We are often told not to marry too young because maturity comes with age. But if maturity continuously improves our ability to choose partners, why wouldn’t people marrying at 40 automatically have the most stable marriages?
The folk theory is tidy. Self-knowledge accumulates, so a person of thirty chooses better than a person of twenty-one, and a person of forty better still. Maturity ought to keep compounding all the way up.
It does not, or at least the divorce statistics do not behave as though it does. And the moment you look closely at the research on the best age to get married, the story falls apart in several directions at once. Age at marriage is entangled with education, income, religion, prior relationships and country. Divorce statistics measure the dissolution of marriages, not the presence or absence of love. And the most-cited finding on the subject is contested by serious researchers using different data.
The short answer
| Claim | Verdict |
|---|---|
| Marrying very young raises divorce risk | Strong. Replicated across datasets and countries; strongest below twenty |
| Marrying late raises divorce risk | Contested. The famous upturn after 32 appears in some datasets and vanishes in others |
| Age predicts how good a marriage is | Weak to none. Among marriages that last, age at marriage explains very little |
| What does the real work | Education, economic stability, first marriage vs remarriage, presence of violence |
What follows is the evidence behind each of those, including where it disagrees with itself.
What the divorce data actually shows
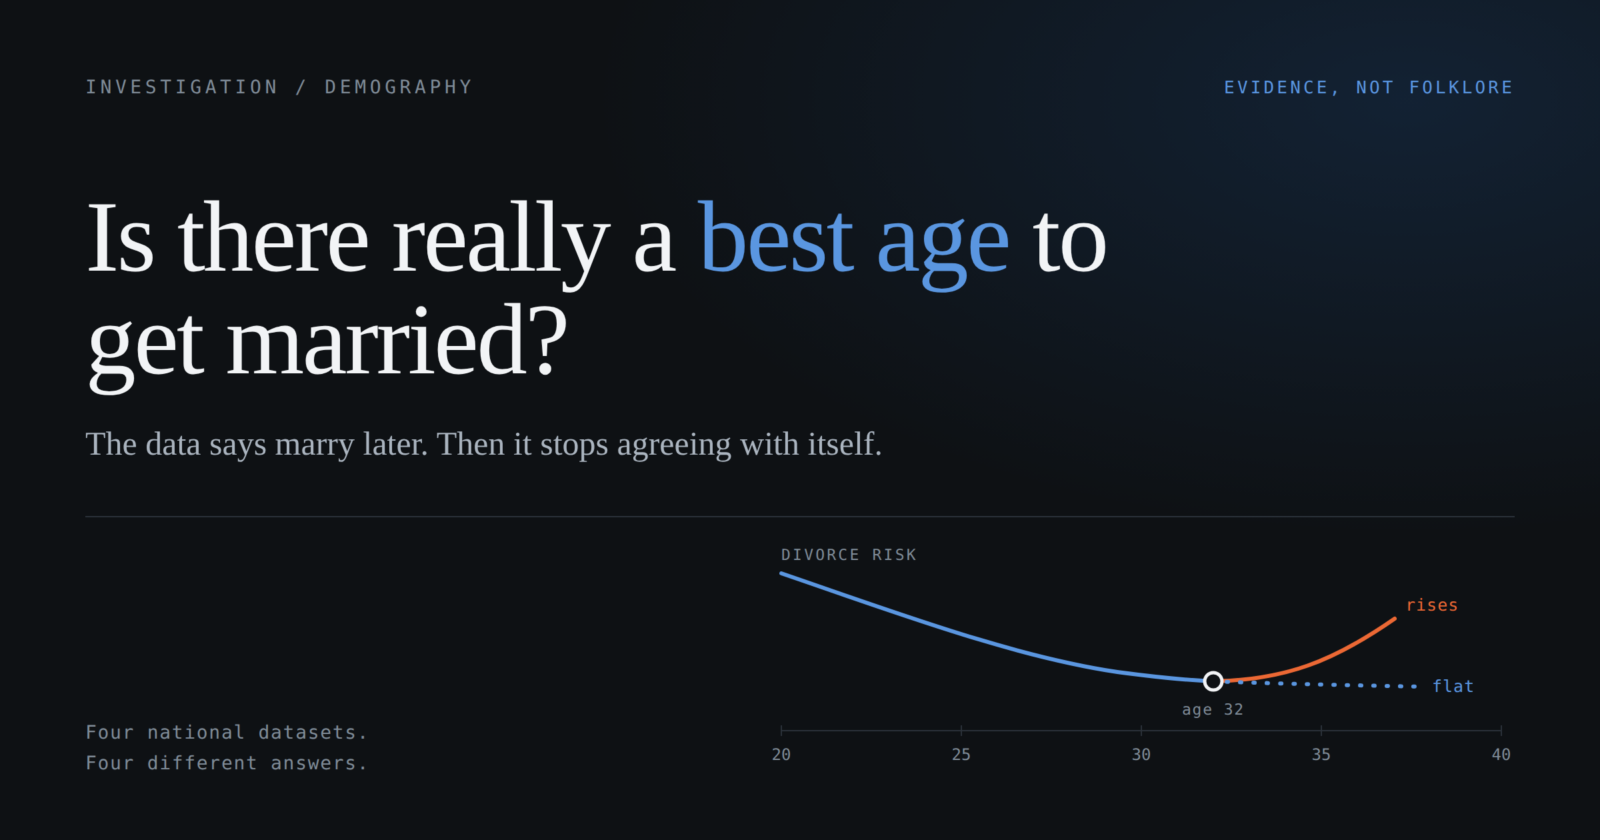
In 2015 the sociologist Nicholas Wolfinger analysed the US National Survey of Family Growth and reported a curve rather than a line:
each extra year of age at marriage cut the odds of divorce by about 11 per cent up to age thirty-two, after which the odds rose by roughly 5 per cent a year. Journalists christened it the Goldilocks effect.
Wolfinger was more careful than his headlines. The survey is cross-sectional, so the effects of education and religious attendance “may not be causal.” It also sampled adults aged fifteen to forty-four, meaning people who married at thirty-five or later had simply been married fewer years when surveyed. Their divorces had not yet had time to happen.
Then other researchers ran the question differently, and got different answers.
Four analyses, four shapes
| Study | Data | Shape of the relationship |
|---|---|---|
| Wolfinger (2015) | US NSFG, 2006–10 and 2011–13 | U-shaped. Lowest risk at ages 28–32; risk rises again after 32 |
| Cohen (2015) | US American Community Survey | Nearly flat after 30. “A little bump up for the late 30s, but it’s very small,” confined to the first five years of marriage |
| Lehrer & Chen (2013) | US NSFG, non-Hispanic white women | No U at all. Risk falls steeply through the late twenties, then levels off |
| Dronkers | 19 European countries plus US and UK | U-shaped in many countries. Lowest dissolution odds at ages 28–30 |
A later analysis by Lehrer and Son split the same survey by ethnicity and the picture fragmented further. For non-Hispanic white women, risk fell until roughly thirty to thirty-two and then flattened. For Hispanic women it fell only until twenty-one to twenty-three, flattened, then turned upward beyond thirty-two. For Black women it fell until twenty-four to twenty-six and then flattened. The authors traced the divergence to how differently delayed marriage relates to educational gains and to childbearing outside marriage across these groups.
The U-shaped curve is not a fact about human beings. It is a fact about particular populations in particular circumstances, and it changes shape when the circumstances change.
Where a late-marriage penalty does appear, the explanations researchers offer are not about maturity at all. Dronkers proposed two. The first is a partner-market argument: people entering a first union late face a shrinking pool of never-married partners, and are more likely to match with someone previously divorced, which independently raises dissolution risk. The second is selection: whatever makes partnership difficult may also make it late.
Age, or everything that travels with it?
The strongest evidence that age matters at all sits at the young end. It also comes braided with class.
Chart 1. Divorce rates by age at marriage and education (grouped bar chart)
| Education | Married aged 15–22 | Married aged 23–28 |
|---|---|---|
| Less than high school | 68.8% | 54.1% |
| High school graduate | 57.2% | 49.9% |
| Some college | 60.0% | 45.6% |
| Bachelor’s degree or higher | 46.6% | 31.3% |
US Bureau of Labor Statistics, NLSY79: 7,357 people born 1957–64, followed through 8,112 marriages to age 46. Marrying later lowers the rate at every education level. Finishing a degree lowers it further. Neither can be declared the cause of the other.
At the extreme young end the evidence is less ambiguous, and it is about harm rather than stability. Across thirty-four countries, 29 per cent of women who married before eighteen reported physical or sexual partner violence in the past year, against 20 per cent of those who married as adults. The World Health Organization, drawing on 161 countries, estimates that 24 per cent of adolescent girls who have been in a relationship experience such violence by age twenty, and says plainly that child marriage escalates the risk through age gaps, economic dependency and isolation. That is not a finding about the best age to marry. It is a finding about power.
There is also a category error running through the whole debate. Divorce risk is not marital quality. The CREATE study followed roughly 1,900 women and 1,700 men who married around 2015, measuring sixteen dimensions including communication, conflict management and sexual satisfaction. Age at first marriage had weak to no influence on any of them. You can be statistically less likely to divorce and no happier at all.
A divorce rate is not a happiness rate
Divorce rates cannot be read across borders as though they mean the same thing, and the clearest proof is domestic. In England and Wales in 2023, 74.2 per cent of divorces were granted under the Divorce, Dissolution and Separation Act, up from 9.2 per cent the year before. Nothing about British marriages changed that dramatically in twelve months. The statute did.
Age at first marriage, women (horizontal bar chart)
| Country or bloc | Age | Measure |
|---|---|---|
| England & Wales | 33.0 | Median, 2023 (ONS) |
| South Korea | 31.6 | Mean, 2024 |
| OECD average | 31.0 | Mean, 2021 |
| United States | 28.0 | Median, 2025 (Census Bureau) |
| Pakistan | 20.4 | Median, 2017–18 (PDHS) |
Medians and means are not identical measures; both are shown as published.
The same number, three different meanings
| Place | Figure | What it conceals |
|---|---|---|
| India | 0.24% (2011 census) | Share of the married population recorded as divorced. The separated population is nearly three times larger. Gujarat’s dissolution rate exceeds Belarus’s |
| European Union | 1.6 per 1,000 (2024) | Double the 1964 rate, while the marriage rate halved. In Sweden 57% of births are outside marriage, so many unions never enter the statistic at all |
| Sub-Saharan Africa | 6.9–47% (20 countries) | Probability of divorce within 20 years of marriage, from Mali to Congo-Brazzaville. Rates are stable or falling, which researchers link partly to rising age at first marriage |
| Egypt | 0.9 → 2.3 (2004–2020) | Per 1,000 population. Rates in Iran and Saudi Arabia roughly doubled over the same period |
A low divorce rate may reflect contented couples, or stigma, financial dependence and procedural difficulty. A high one may reflect not indifference to marriage but an expectation that a marriage should be good, and the means to leave one that is not.
Love at 22, 32 and 42
Does romantic love itself change with age, or only its packaging? We know less than the popular-science shelf implies. The most-cited neuroimaging work on long-term love scanned seventeen people with a mean age of about fifty-three, married an average of 21.4 years. Images of their spouse activated the same dopamine-rich reward regions seen in the newly in love. What differed was the obsessive component: the reward response persisted, the intrusive preoccupation did not. Seventeen participants is a very small sample, and this is suggestive rather than settled.
Survey work points the same way. In a random sample of 274 married Americans, 40 per cent of those married more than a decade described themselves as “very intensely in love” (a separate New York sample of 322 produced 29 per cent). The correlates were unmysterious: thinking well of your partner, thinking about them when apart, physical affection, sexual intimacy, shared novel and difficult activities. Nothing on that list is age-dependent. And a meta-analysis of 165 studies covering more than 165,000 people found relationship satisfaction at its lowest around age forty and around ten years of duration, rising again until about sixty-five. If satisfaction has a trough, it is in midlife, not in youth.
On the chemistry. It is common to read that oxytocin causes bonding. A 2023 systematic review of nineteen human trials found mixed results and strong sensitivity to dose. More strikingly, when researchers at UC San Francisco used CRISPR to create prairie voles entirely lacking functional oxytocin receptors, the animals formed monogamous pair bonds indistinguishably from normal ones. Thirty years of assumption about a single necessary mechanism did not survive the experiment. Oxytocin is part of a system. It is not the system, and it is not a feeling.
What actually changes after 35
Someone marrying at forty arrives with a career, possibly property, a pension, established routines, a history of serious relationships, sometimes children, and a clear sense of what they will not tolerate. The popular question is whether this makes marriage less romantic. The answerable question is narrower: does the caution such people show have a basis? It does.
Divorces per 1,000 married people aged 50 and over, US 2019 (horizontal bar chart)
| Group | Rate per 1,000 |
|---|---|
| Married 0–9 years | 18.13 |
| In a remarriage | 14.21 |
| In a first marriage | 7.59 |
| Married 40+ years | 3.80 |
Brown and Lin, Journals of Gerontology: Series B, 2022. Remarriages among the over-fifties dissolve at nearly twice the rate of first marriages. Someone marrying at forty-five with children from a previous marriage and a pension to protect is not being cynical. They are reading a real risk profile.
The formalization of that caution is the prenuptial agreement: a 2023 Harris Poll found about one in five married American couples had one, while support among US adults rose from 42 to 50 per cent in a single year.
Does love become a calculation?
Presented as an accusation, the claim collapses. There is no instrument measuring the intensity of love and no dataset showing that forty-year-olds feel less. The survey evidence and the imaging work both point the other way.
Presented as a question about behaviour, it has content. Older daters have more to protect and coordinate: assets, pensions, children, ageing parents, a career that may not be geographically portable. Attending to those things is not an alternative to love. It is what love looks like when attached to a life that already has weight in it. And where late marriages do prove less stable, the leading explanations are about circumstance rather than character: a thinner pool of never-married partners, or the selection effect by which whatever makes partnership difficult also makes it late.
Biology, which does not negotiate
Marital stability and reproductive biology are separate questions that get collapsed into one, usually to somebody’s cost. Fertility is not the purpose of marriage, and a population average cannot tell any individual couple what will happen to them. With those two things said, the age gradients are real.
Table 3. What the age gradient looks like
| Measure | Younger | Older | Source |
|---|---|---|---|
| Miscarriage risk | 10% (age 25–29) | 53% (age 45+) | Norwegian registry, 421,201 pregnancies, 2009–13. Overall rate 12.8%; rises steeply after 30. Authors call it descriptive, not causal |
| IVF birth rate per embryo | 38% (age 18–34) | 8% (age 43–44) | UK HFEA, 2024. Assisted reproduction does not reset the clock |
| Autism diagnosis in offspring | reference (father 25–29) | 2.27× (father 45–49) | Fertility and Sterility review |
| Schizophrenia in offspring | 1 in 141 (father under 25) | 1 in 47 (father 50+) | Finnish cohort. Absolute risk stays low: a doubling of a small number is still a small number |
Against this, a sibling comparison of more than 1.5 million Swedes born 1960–91 found children of older mothers were taller, achieved better school results and were likelier to attend university. The mechanism is historical rather than biological: being born later meant better schools and a wealthier household. Later parenthood is not straightforwardly worse for children.
Why marriage moved later, and what culture does to the question
None of this happened because a generation decided romance was overrated. In South Korea the annual number of marriages has nearly halved since the late 1990s, and since 2021 more women in their early forties have married than women in their early twenties. The reasons given are housing costs, scarce stable employment, stagnant real wages, and the perception among educated women that marriage obstructs careers where domestic work remains unequally divided. The same forces operate elsewhere in gentler form, alongside the decisive one: women’s economic independence removed the financial necessity that once made early marriage rational. The Knot Yet report found American college-educated women in their mid-thirties who married at thirty or later earned around $18,000 a year more than those who married before twenty. Delay has a payoff, concentrated among those who can afford it.
So is later marriage culture or economics? Both, inseparably. The wish to be established before marrying is cultural; the time it now takes to become established is economic.
Culture also rewrites what the question means. Where marriage is an individual romantic choice, the right age is when a person feels ready. Where families are parties to the marriage rather than guests, the right age is set by a different calculus: education completed, circumstances aligned, obligations discharged. A small study of people in arranged marriages, averaging sixteen to nineteen years together, reported love rising over time from a mean of around 4 or 5 to around 9 on a ten-point scale, with sacrifice and commitment named as what built it. Fifty-two self-selected participants is a hypothesis, not proof. But it describes a route to love that the whole premise of choosing well at the right age does not contain.
And cohabitation scrambles the comparison outright. In much of northern Europe marriage is a later formalisation of a long-standing union rather than its beginning. A Swede marrying at thirty-five may have been partnered and parenting for a decade, which makes their “age at first marriage” incomparable with someone for whom the wedding was the start.
Divorce is not the opposite of success
Measure this by whether a marriage ended and you get nonsense: fifty years of quiet contempt counts as a triumph, a loving decade that concluded amicably counts as a failure.
Paul Amato and Bryndl Hohmann-Marriott examined 509 couples who divorced between two survey waves and found that roughly half had been in high-distress relationships and half in low-distress ones. Half of divorces did not end marriages anyone would have described as miserable. Nor is initiation evenly split: using the How Couples Meet and Stay Together panel, Michael Rosenfeld found women initiated 69 per cent of divorces, while there was no significant gender difference in non-marital break-ups.
The alternative measures point elsewhere entirely. The Harvard Study of Adult Development, running since 1938, found that satisfaction with relationships at fifty predicted physical health at eighty better than cholesterol did. Not marital status. Satisfaction.
Qualitative work makes the same point from inside. In a Swedish study, thirty-seven people aged sixty-two to eighty-two who had divorced after sixty described what had happened. Some had built a life around shared projects and found, once the children had gone and the work had ended, that nothing remained: “Our relationship didn’t break down, it ended because it had no purpose.” Others described a partner altered by illness. A third group, mostly men, framed leaving as a last chance: “When you are 80 I don’t think you have the energy for a divorce, so it was now or never.” None of these is a story about having married at the wrong age.
So, is there a best age to get married?
Maturity does keep improving judgement. What it does not do is keep improving circumstances. The forty-year-old chooses better and chooses from a thinner, more complicated field, with more to merge and more that cannot be moved. Those two effects run against each other, and which one wins depends on the country, the community and the particular life. That is the resolution of the paradox this article opened with.
Table 4. What predicts a marriage lasting
| Factor | Evidence | Verdict |
|---|---|---|
| Marrying under 20 | Replicated across datasets and countries; below 18, the dominant issue is coercion and violence rather than stability | Strong |
| Education | A degree cuts divorce rates by roughly a third at every age at marriage in the NLSY79 cohort | Strong |
| First marriage vs remarriage | Remarriages among over-fifties dissolve at nearly twice the rate of first marriages | Strong |
| Marrying after 32 | Appears in two datasets, vanishes in two others, varies by ethnic group within the same survey | Contested |
| Age at marriage → marital quality | Weak to no influence across sixteen measured dimensions in a recent nationally representative cohort | Weak |
| A single optimal age | No universal “sweet spot” survives once cohort, duration and population are accounted for | Not found |
Age is correlated with several of the factors above. It causes none of them.
There is no best age to get married. There is a combination of maturity, compatibility, circumstance and commitment that makes a marriage more likely to work, and it arrives on no fixed schedule.
Some people assemble it at twenty-three. Some assemble it at forty-five. A good many who never marry at all assemble it anyway, and the research on wellbeing suggests that what they have built is the thing that was worth building.
Five FAQs
1. What is the best age to get married according to research? No single age is supported by the evidence. US analyses of the National Survey of Family Growth have reported the lowest divorce risk for marriages beginning around ages 28 to 32, but analyses using American Community Survey data and studies of specific population groups do not replicate that pattern. The consistent finding is that marrying very young, particularly under 20, carries elevated risk.
2. Does marrying after 35 increase the risk of divorce? It depends on the dataset and the population. Some analyses find a modest rise in divorce risk after the early thirties; others find the risk simply levels off. Where a rise does appear, researchers attribute it largely to a smaller pool of never-married partners and to selection effects rather than to age itself.
3. Is it better to marry young and grow together? Marrying young means sharing formative adult experiences, which plausibly builds joint investment. It also carries a higher statistical probability of divorce, particularly at lower levels of education. Research on marital quality suggests young marriages that last are not lower in quality, so the risk concerns whether a marriage endures, not how good it is.
4. How does age affect fertility and family planning decisions? Female fertility declines gradually from the early thirties and more steeply after 37. Miscarriage risk was lowest at ages 25 to 29 in a large Norwegian registry study, rising to 53 per cent at 45 and over. Paternal age also matters, with offspring risks emerging from around 40. These are population averages and cannot predict any individual outcome.
5. Do people marry for different reasons as they get older? There is no evidence that older people feel love less intensely. There is evidence that they marry with more to coordinate, including property, pensions, children from previous relationships and established careers, which makes practical compatibility a larger part of the decision. Researchers generally read this as changed circumstances rather than changed feeling.
Researched by: News and Noise
The conversation